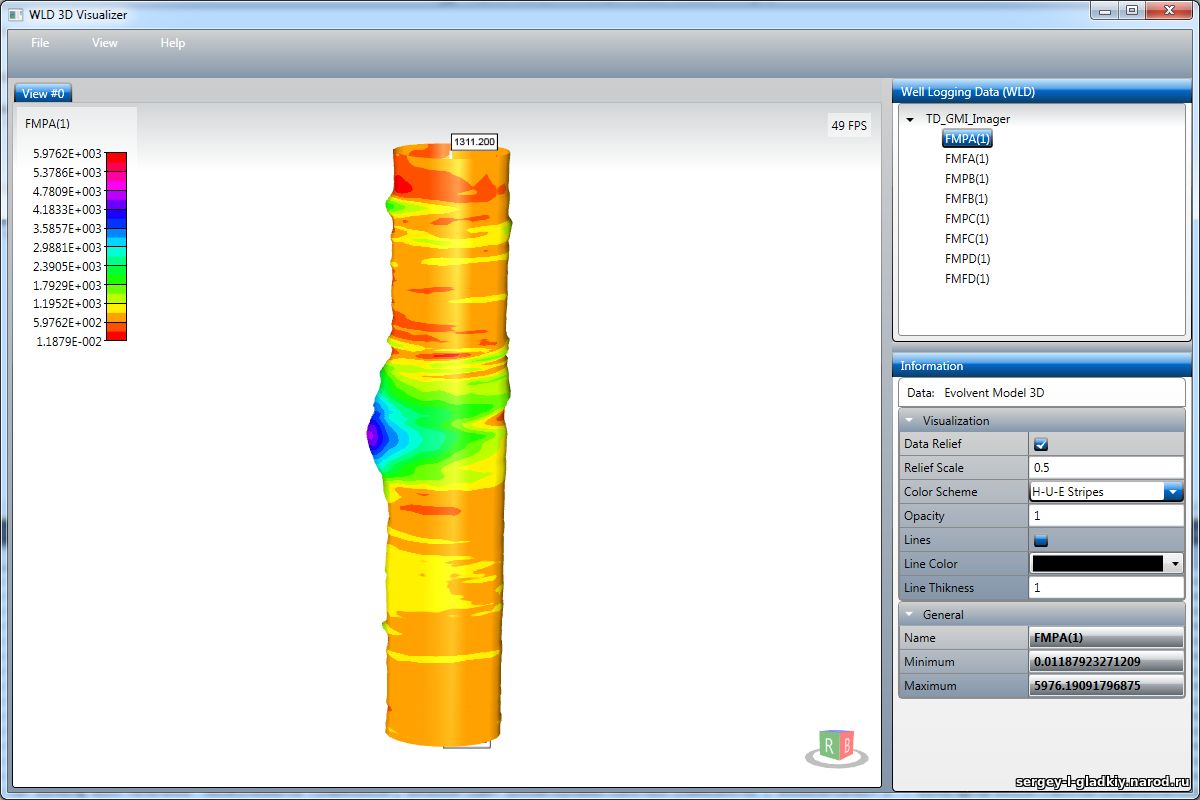
WLD 3D Visualizer (Well Logging Data 3D Visualizer) is a simple application for visualizing well logging data as 3-dimensional images. The 3D representation allows truly imaging of some borehole parameters. The program allows 3D visualization of curves and 2D channels. All curves (1D channels) are visualized as cylindrical surfaces along the depth axis. The radius of the cylinder on each depth reflects the curve value measured on this depth. The 2-dimensional channels (having an array of values on each depth) are visualized as 3D surfaces along the depth axis.
Download demo versions:
Windows (X32, X64): WLD3D DEMO Setup
Documentation: WLD3D_Guide.pdf
Buy full version: Ask the author directly by e-mail: lrndlrnd@mail.ru
Russian: Buy online
The program supports all most popular well logging data file formats:
- LAS (Log ASCII Standard);
- LIS (Log Information Standard);
- DLIS (Digital Log Interchange Standard).
WLD 3D application allows easily:
- Manipulate 3D space screen view: rotate, pan and zoom the model with the mouse device.
- Set up different channel 3D visualization models: color schemes, relief, line grid, transparency.
- Move down and up the virtual borehole model with the real visual investigation of the logging data.
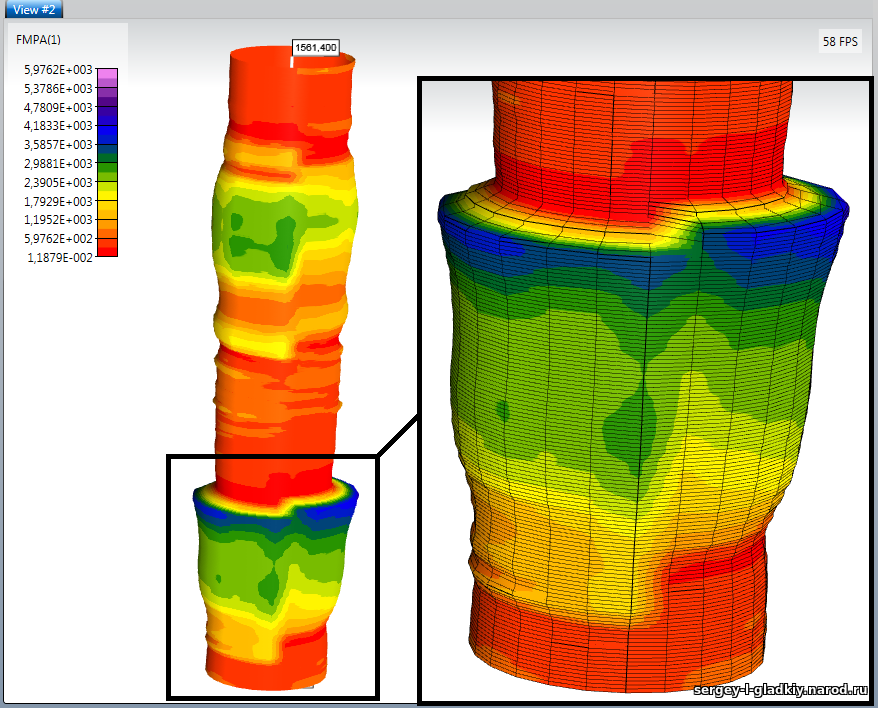
Examples of channel
Evolvent 3D visualization (with increased bottom area view):
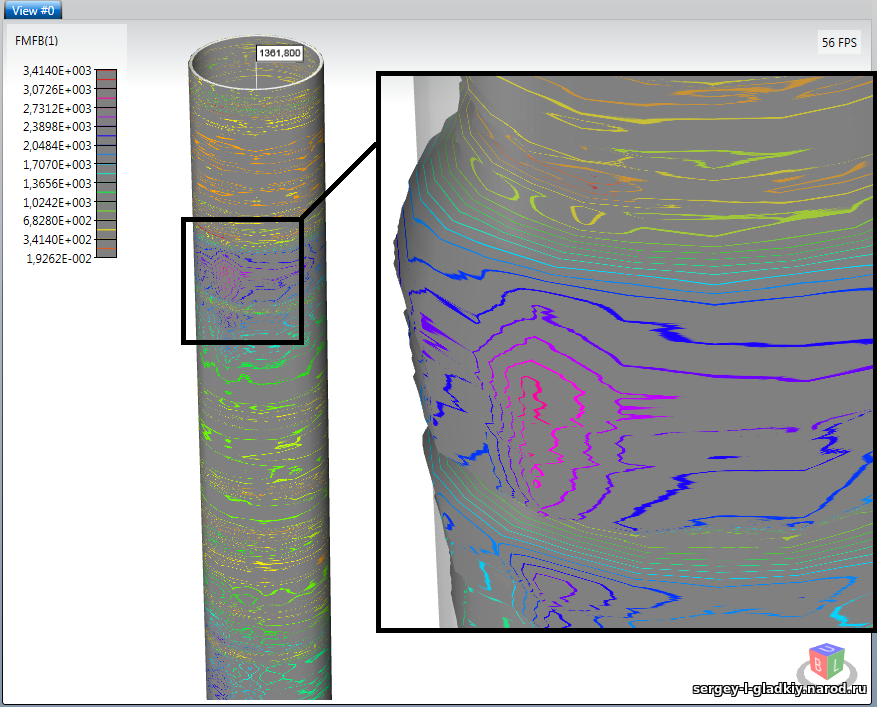
Evolvent 3D isoline map (with increased bottom
area and relief):
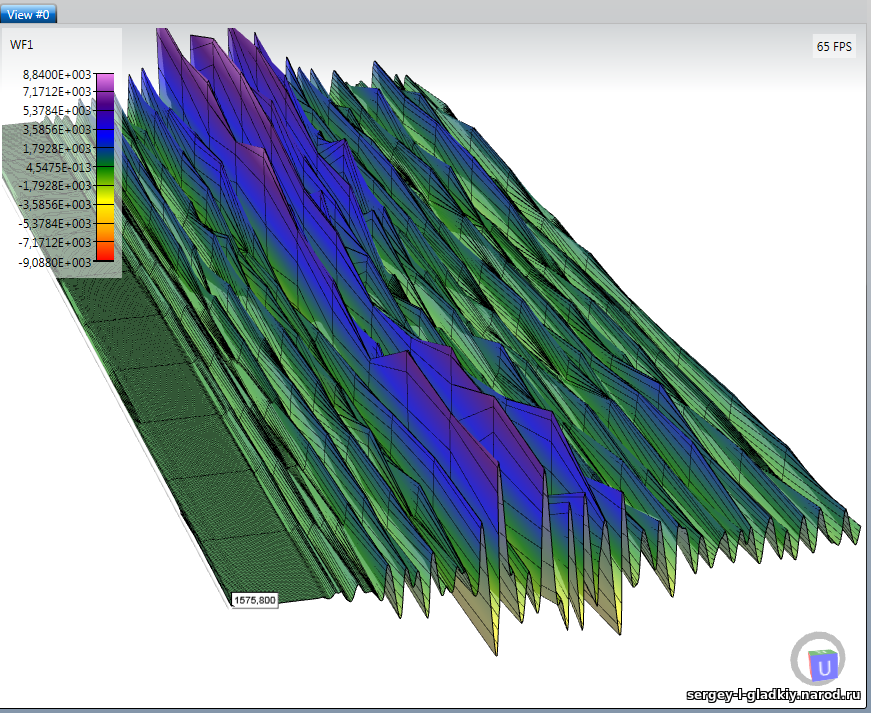
Wave signal 3D relief map:
© Sergey
L. Gladkiy